
FastReport Business Graphics .NET Standard Edition
- Brand: Fast Report
- Product Code: FastReport Business Graphics .NET
- Availability: In Stock
FastReport Business Graphics .NET
Data visualization library for .NET WinForms

With FastReport Business Graphics library you can visualize different hierarchical data, build business diagrams for further analysis and decision-making.
All this can work directly in your application!
Features
Data
Ability to use hierarchical data from the application, including those prepared in FastCube .NET
read more...
Interactivity
When static reports are not enough, the FastReport Business Graphics charts provide excellent interactive opportunities.
read more...
Visualization
Helps to make an informed decision with better data visualization.
read more...
Integration
The complementary element of your documents’ infrastructure: ideal integration with the report generator FastReport .NET and OLAP-cube FastCube .NET.
read more...
Data visualization library
The FastReport Business Graphics .NET library is designed for use in WinForms applications with the .NET Framework 4.x.

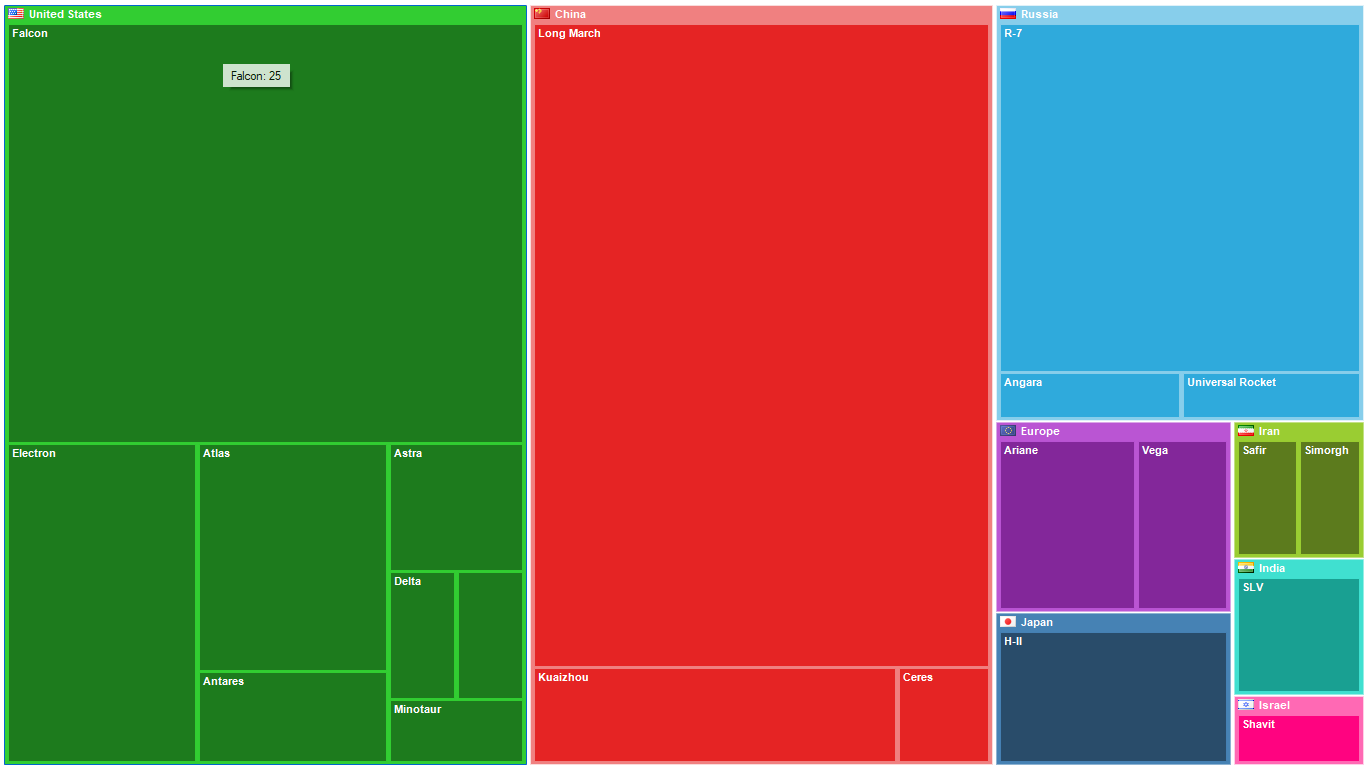
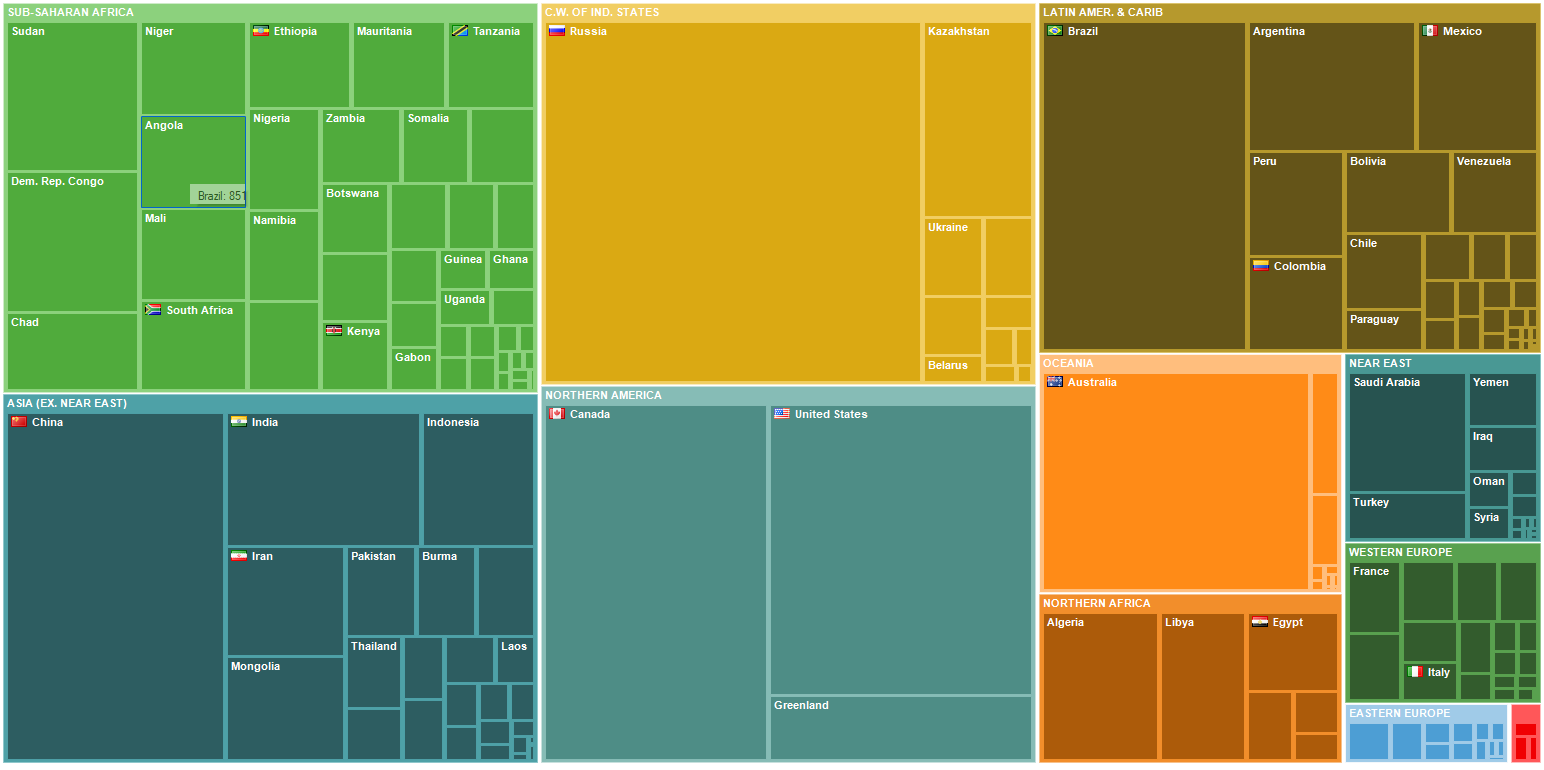
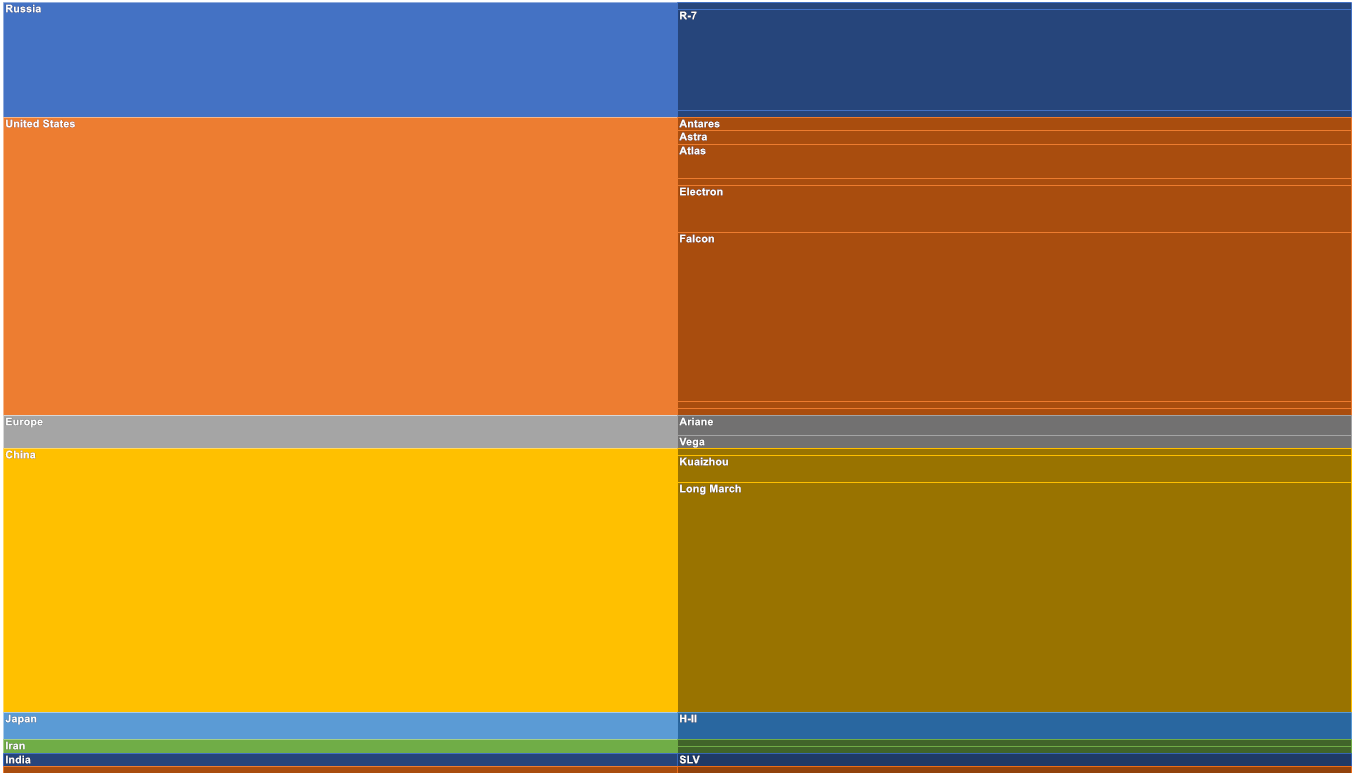
A Treemap chart
is a way of visualizing hierarchical data in the form of rectangles whose area is proportional to the value of the displayed record. Within the rectangles of parent records are nested rectangles of child records. This tree chart is suitable for comparing several hierarchies at the same time.

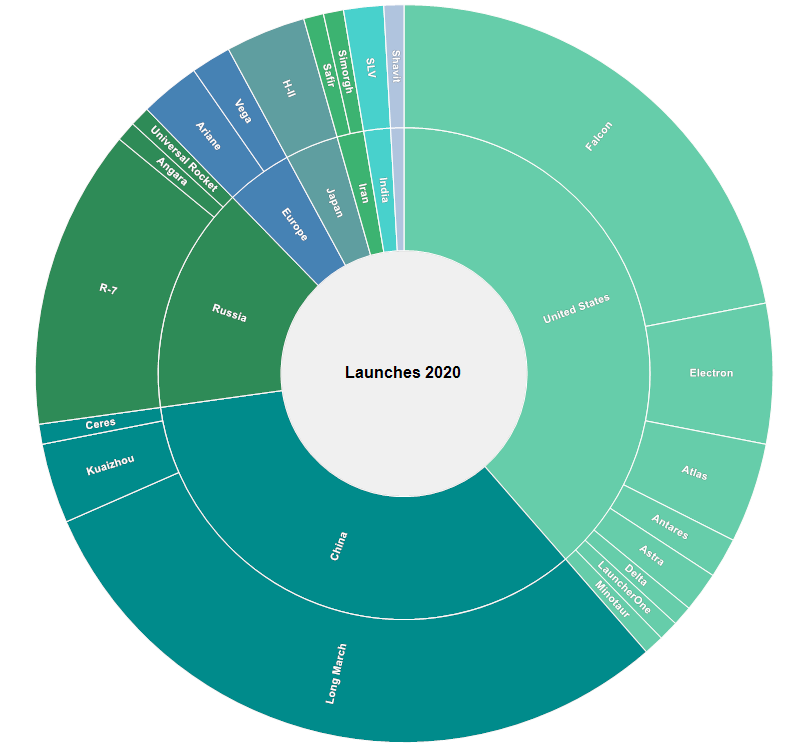
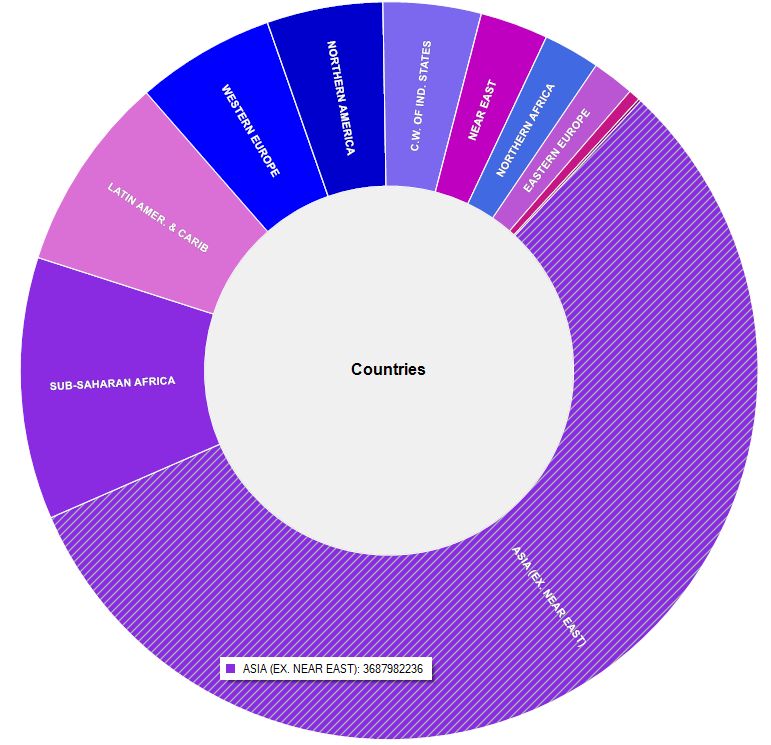
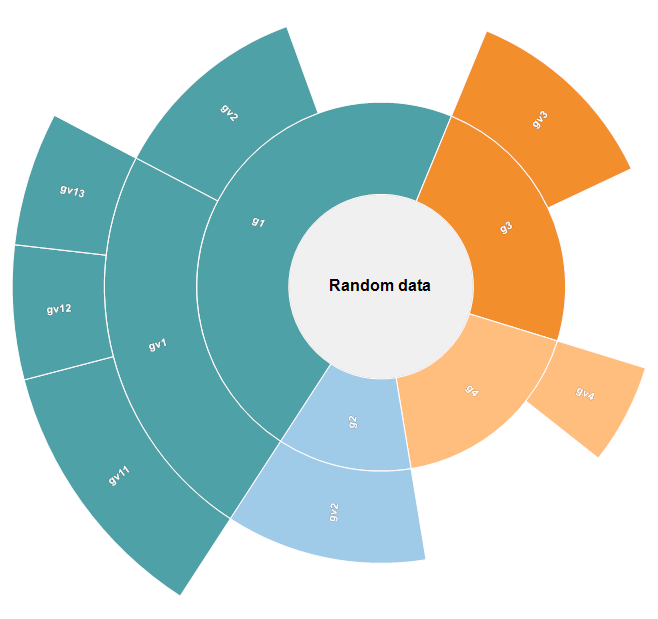
The Sunburst chart
is a sun-like chart with branching rays. The circle in the center is the root node, and the rays that move outward are the children. Each value on the chart occupies an area, the boundaries of which are defined by the start angle and the sweep angle. The larger the value you want to display on the chart, the larger the sweep angle. This chart is suitable for analyzing each level of the hierarchy.

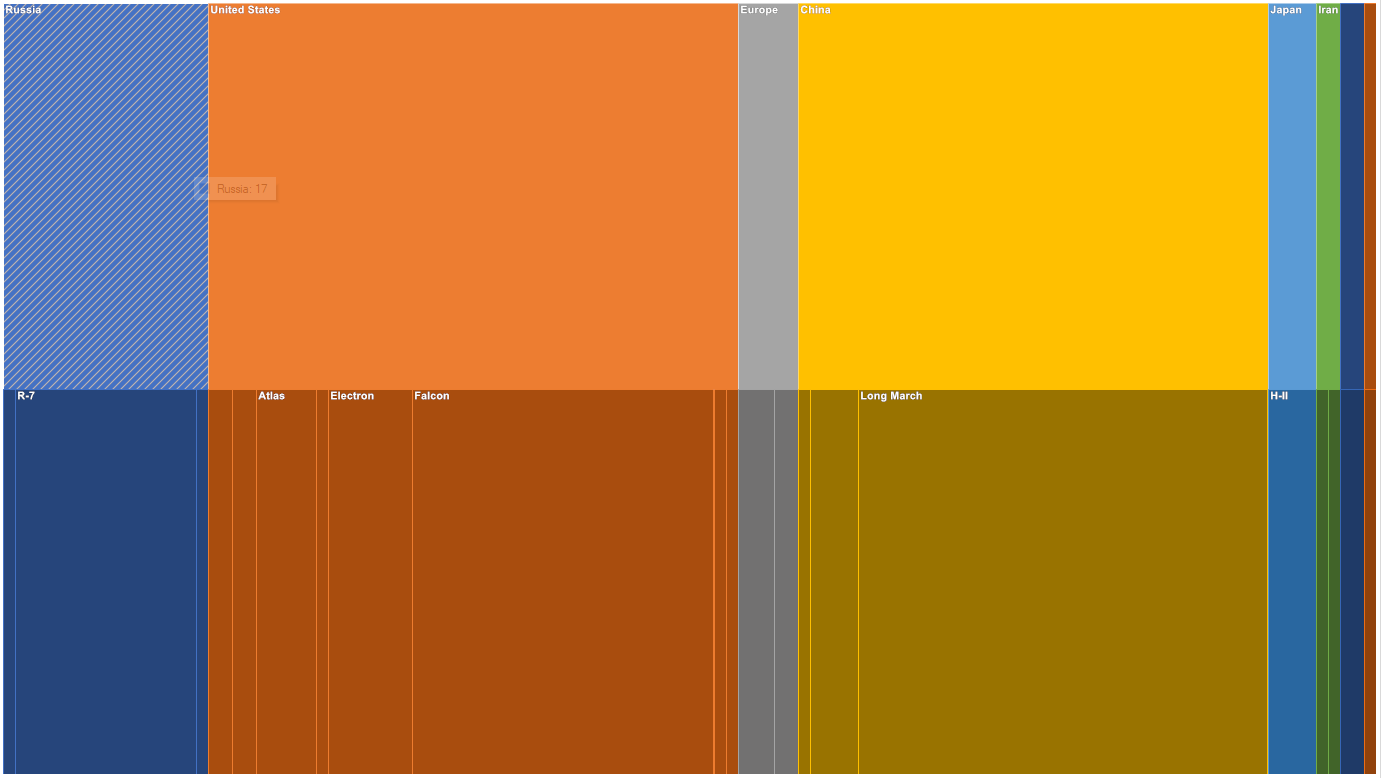
An Icicle chart
presents data based on the hierarchical clustering method. The Icicle chart is easier to read, showing which hierarchy objects belong to and which are children. The large rectangle at the top of the chart represents the root node, whose width depends on the sum of the child nodes. The child nodes are placed below the parent nodes. The chart can also have several drawing directions: down, up, left, and right. An icicle graph is a good way to visualize hierarchical data. The advantages are that it is easy to see the hierarchy, its size, and the level at which it is located. It's also great for examining data relationships.

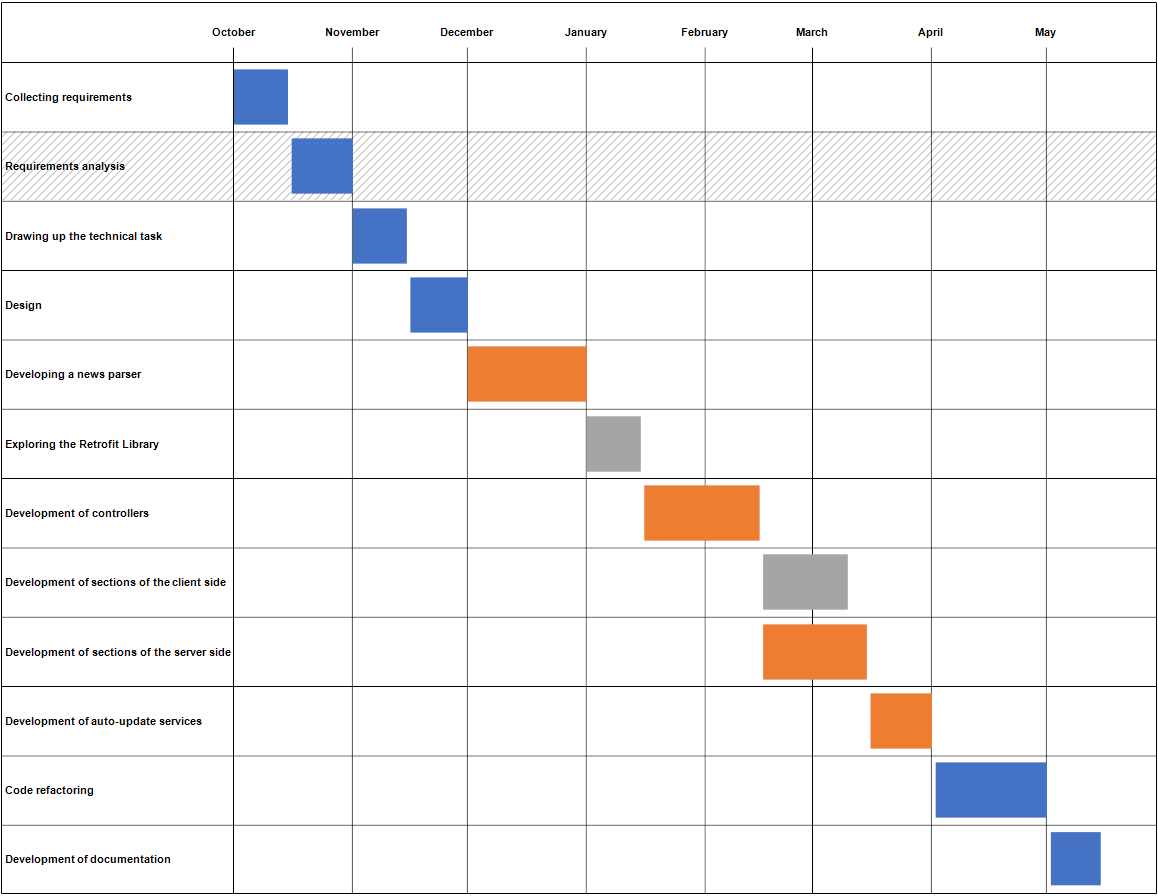
A Gantt chart
illustrates a work plan/schedule for a project. It consists of two parts: the left part has a list of tasks, and the right part has a timeline with bars that depict the work. The colors for the intervals are allocated according to the resources from the palette. This chart helps to solve one of the main tasks of business process planning and show the staff what to work on, what resources to apply in the process and at what speed to perform certain tasks. Using a Gantt chart makes it much easier to manage small projects.
Screenshot
Try it for free
FastReport Business Graphics .NET Absolutely for free
Tags: FastReport Business Graphics .NET, Standard, .NET, Document & Office, Fast Report