


amCharts 4: Charts
A new kind of advanced data-viz is finally here!
A go-to library for data visualization. When you don’t have time to learn new technologies. When you need a simple yet powerful and flexible drop-in data visualization solution. Includes all basic and advanced chart types, as well as is extendable by additional plugins like Maps and TimeLine.
Check demos
Download
Licensing
Wide selection of chart types in a single package
It’s easy with amCharts 4 – all chart types, including geographical maps, come in a single, easy to understand product!
No need to figure out product line up – just get amCharts 4 for everything.
And since it was designed to work with modern web dev toolkits like React, Angular, Vue, Ember, it will just fall into place, right out of the box.
The most advanced chart package
Classics with some new twists
XY charts are now so powerful and flexible, you can plot any data on them. Number, date, duration, or category axes are supported, in all directions.
The axes can now contain interactive breaks, that expand on hover and actually look awesome.
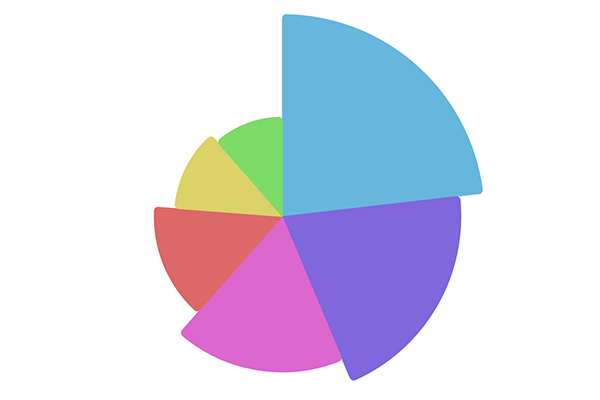
Pie charts are now fully nestable, with support for custom start and end angles, to create half circles.
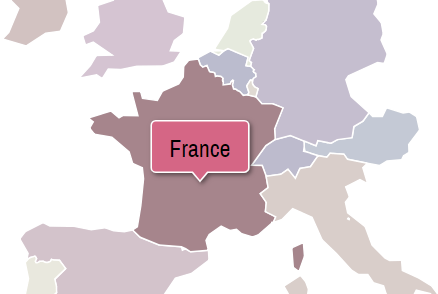
New geo maps
Maps now use GeoJSON format! Being open and widely accepted standard it opens up a lot of possibilities and sources for ready-made and custom maps.
Furthermore, maps are now very flexible, with multi-series support, configurable down to the nut and bolt.
(Maps is and add-on to amCharts 4 which requires separate license)
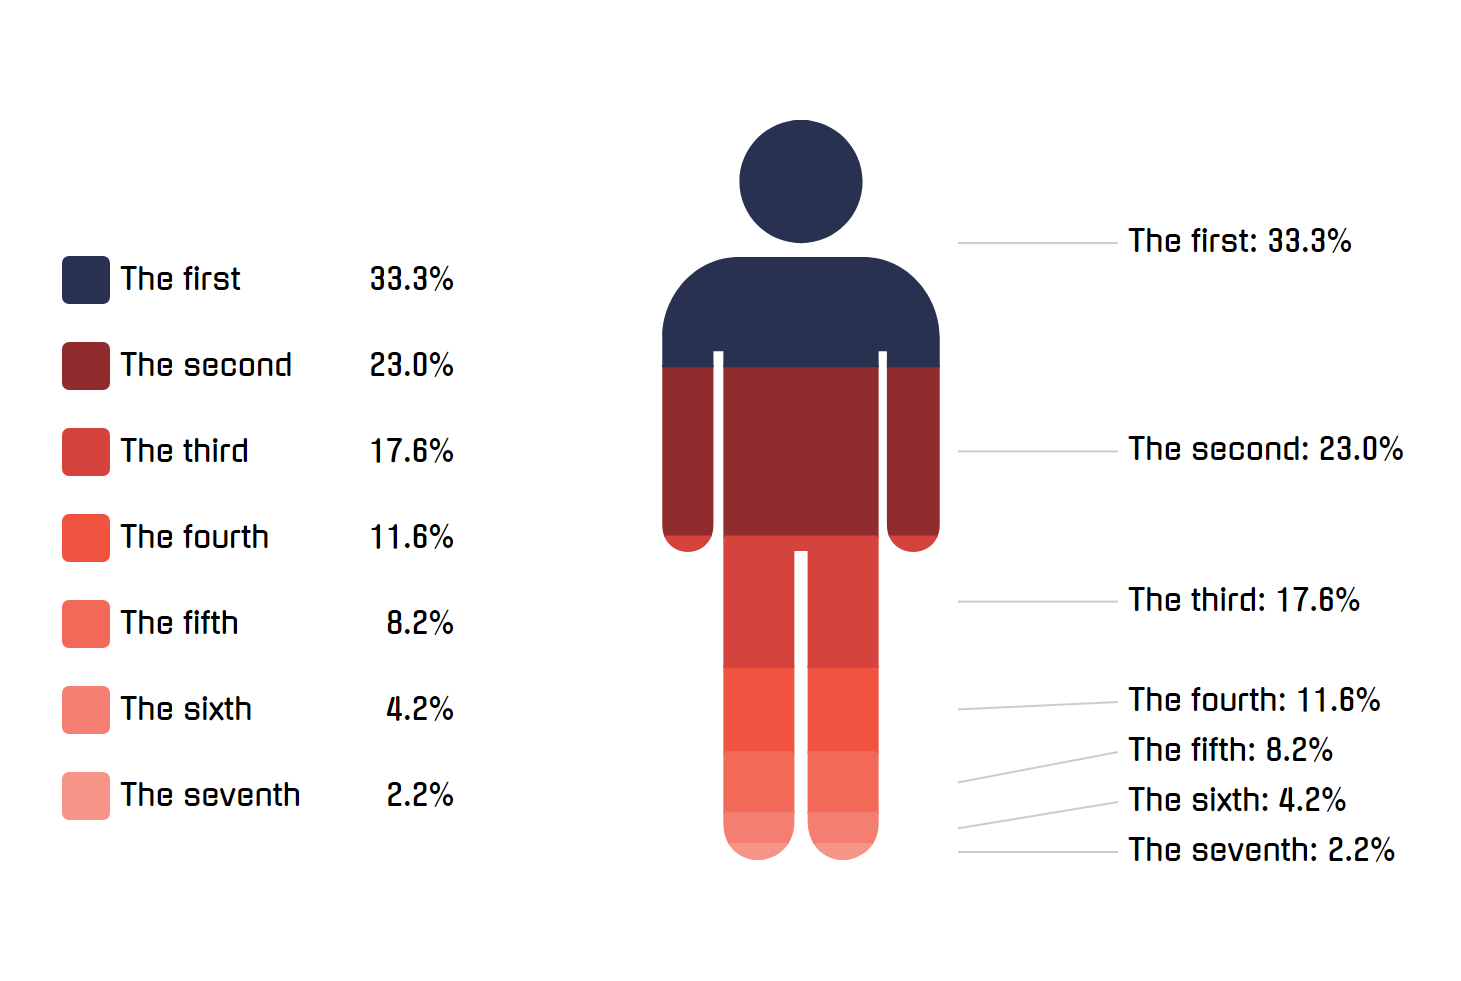
Pictorials
Create multi-layer, multi-series pictorial charts. Any SVG path can be used as a shape for your chart.
Tags: amCharts, Web Application Framework Library, JavaScript, amCharts 4: Charts