


amCharts 4: TimeLine
TimeLine is an add-on to amCharts 4: Charts.
While the name implies it’s used to represent timelines, it’s actually useful everywhere, where you need to dazzle your users with a uniquely shaped chart.
TimeLine demos
Download
Back to Charts
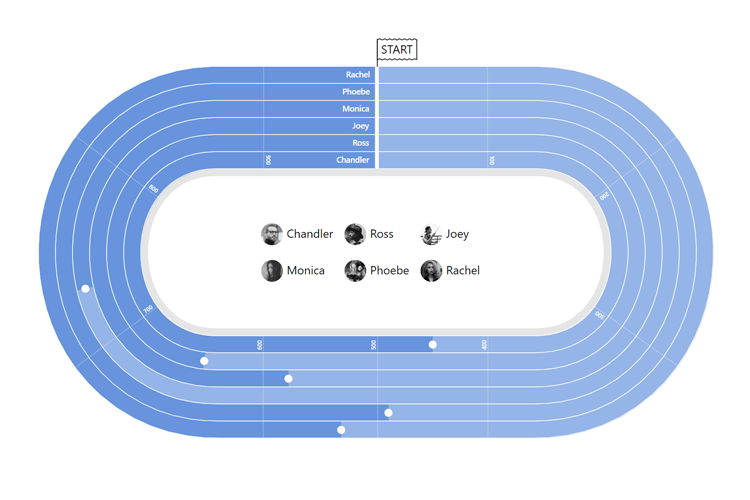
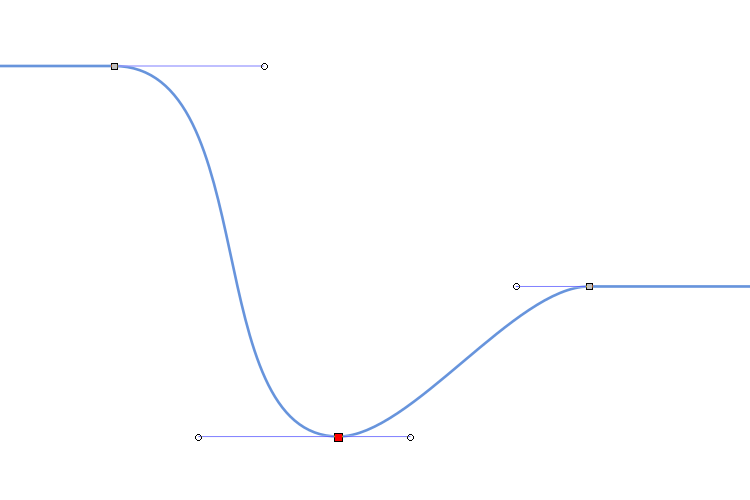
Uniquely shaped charts
Supply custom points, and the chart will magically follow them. You can even control the smoothness of the curve.
That day line you see up top on this page, it’s a live chart.
Draw your own shape
Don’t want to use a pre-defined shape? Grab any vector graphics editing software such as Adobe Illustrator or Inkspace and draw your own!
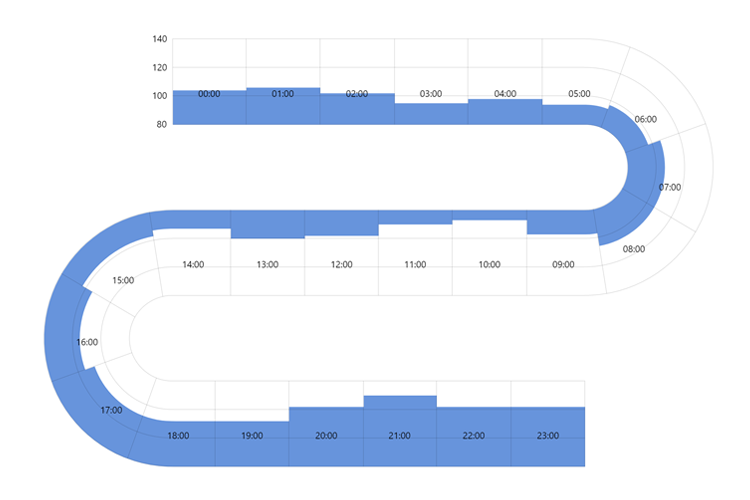
Serpentine chart
Automatically create waved charts with configurable number of levels, orientation, radii, and other options.
Check out the demos:
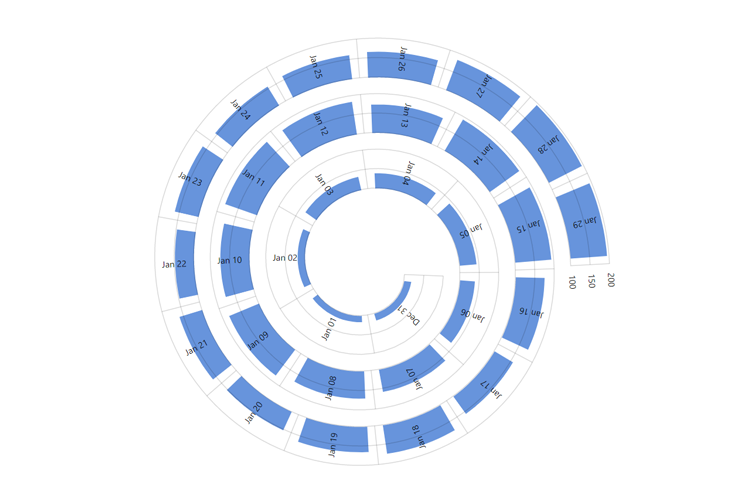
Spiral chart
Make a spiral chart in seconds. Configure it the way you like: number of rings, angles, radii, and a number of other options.
A few live Spiral chart demos:
Fully interactive
Charts created with TimeLine chart types are fully interactive – just like any other amCharts 4 chart. Hover effects, tooltips, cursor functionality, animations, zooming, legend toggling, and everything else you expect from a full-fledged chart.
Rich series type support
Add multiple Line, Column, Step, Area series. Mix and match. Stack or cluster them.
Advanced chart features
TimeLine charts are full-fledged charts, which means you can use most of the XY features, like bullets, axis ranges, adapters, event handlers, and everything else.
Extensive documentation
Just like with any other chart type, TimeLine add-on comes with extensive, step-by-step documentation.
Tags: amCharts, Web Application Framework Library, JavaScript, amCharts 4: TimeLine